Click here to jump to the beginning of the BEAMTAP home page.
The following figures were generated by a simulation tool created as a widget based GUI under the IDL programming language. This tool was developed with the objective of simulating the optical implementation of the BEAMTAP algorithm for true-time delay adaption of large antenna arrays for detection of broadband signals in the presence of multiple strong broadband jammers. This work is being developed under a MURI sponsored by the Office of the Secretary of Defense (DDR & E) managed by Dr. William Miceli of the Office of Naval Research.
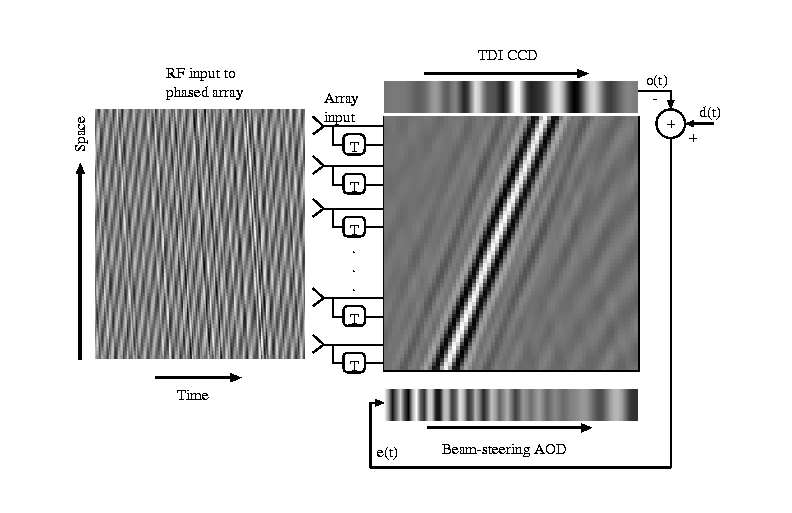
Diagram describing the simulation of the BEAMTAP optical architecture.
The input signal is represented by the leftmost figure. At every time-step
a instantaneous slice of the input is detected by the antenna arrays and
it is forward propagated through the adaptive weights (center figure) and
detected and accumulated at the TDI-CCD (upper figure). The instantaneous
output Fourier-space representation of the input signals used in the computer
simulation of the optical implementation of the BEAMTAP algorithm. The input
signals are selected in order to test the system's spatio-temporal jammer
nulling capacity over a diversified signal environment. The desired signal
is a broadband gaussian chirp. Jammer 1 is a broadband filtered gaussian
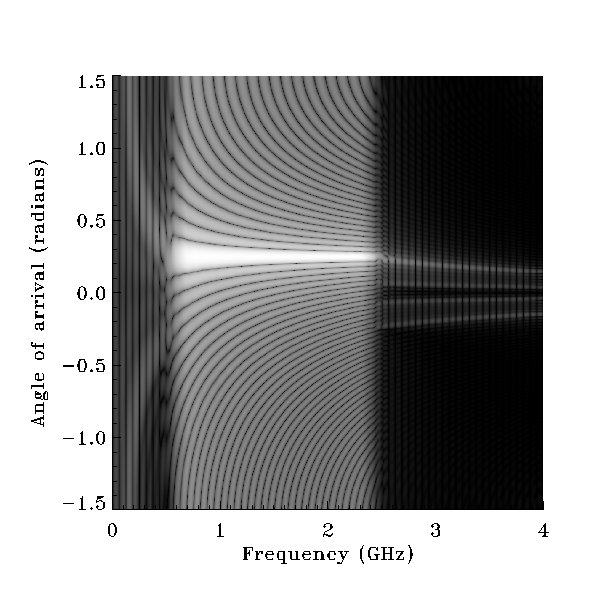
noise and jammer 2 is a single frequency sine wave. Beamforming: Receptivity pattern of the simulated system after adaptation
when only the desired signal is present at the input, demonstrating squint-free
true time-delay beam-forming. Notice that system response (main lobe) spans
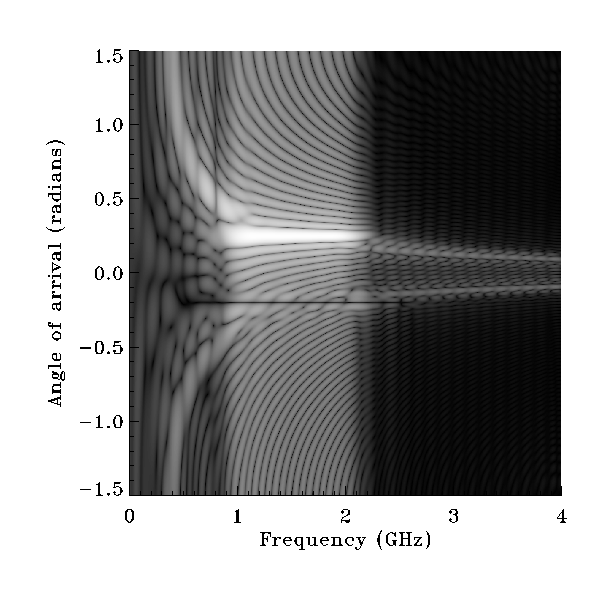
the whole input signal bandwidth. Jammer nulling: Receptivity pattern of the simulated system after adaptation
when the desired signal and strong jammers are present at the input, demonstrating
squint-free jammer suppression with deep nulls. Notice nulls at jammer locations
and slight reduction in the bandwidth of the system response to the desired
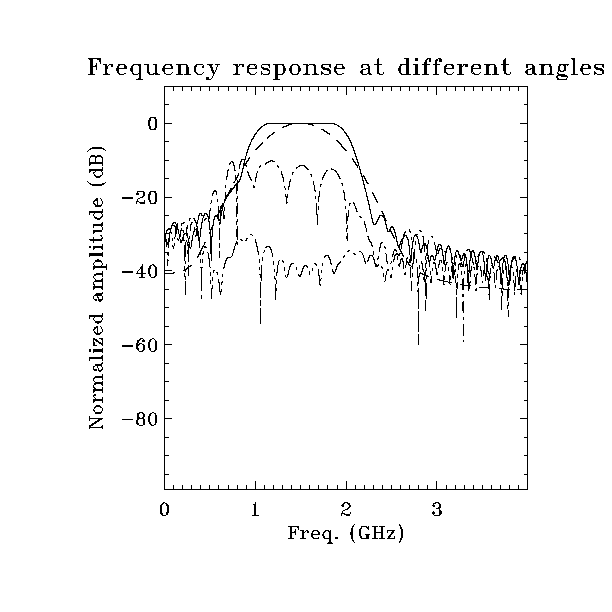
signal. Jammer nulling: Plots of the receptivity pattern at angles of arrival
of interest. Solid line: 0.25 radians. Beamforming at the angle of arrival
of the desired signal. Dashed line: fequency spectrum of the desired gaussian
pulse. Dash-dot: 0.2 radians. Null at the narrowband frequency (0.8GHz).
Dash-dot-dot: -0.2 radians. Wide null at the broadband jammer bandwidth
(from 0.5GHz to 2.5GHz). Notice Wiener filtering, where the bandwidth of
the frequency response at the angle of arrival of the desired signal has
been reduced in order to optimally compensate for the narrowband jammer,
maximizing the signal to interference plus noise (SINR) ratio. 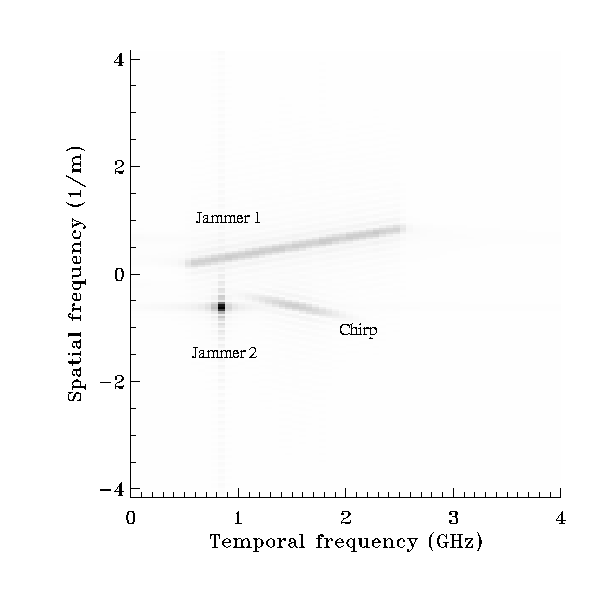
Last Modified: 24/Mar/2002
 Back to my home page.